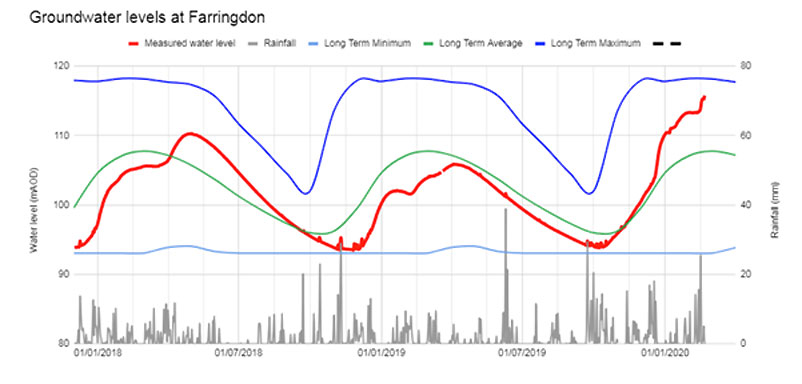
The real-time groundwater levels continue to rise but as mentioned before it is hard to see the big picture from the 5 day trends or where it might be going. My quest for the long term records of borehole groundwater levels continues (the EA claim to be a little busy at the moment…) but they did point me at the first figure, which shows the groundwater level for the last 3 years in relation to rainfall and their long term patterns for annual average levels (green) minimum (pale blue) and maximum (red).
Groundwater flooding begins when levels breach the 118m height (where the dark blue line is highest). The thick red line shows the actual groundwater levels for 2018 to present and clearly shows that whereas levels last winter were below average the wet autumn caused levels to rise sharply, topped up again by storms Ciara and Dennis.
The interesting thing is when you look at the daily rainfall amounts (spiky grey lines) it is clear that some spells of heavy rain affect the groundwater levels yet others seem not to. There are several reasons for this such as seasonal temperature and vegetation activity but there is a tipping point when rain strongly impacts on groundwater levels, and we are in that situation now.
https://assets.publishing.service.gov.uk/government/uploads/system/uploads/attachment_data/file/867917/Hants_GW_flooding_briefing_2020_02_21.pdf
The second plot shows a close up of the relationship between local rain and groundwater levels from January, using data cleaned from the EA.
The daily rain amount is shown in green, the rolling 5 day total in blue and daily groundwater levels in red.
Some very preliminary but quite interesting observations can be made. Under the conditions we are experiencing now, It seems to take about 5 days for heavy rain to raise groundwater levels, which can then level off as the aquifer drains away towards the Wey catchment.
This can be seen in January when heavy rain early in the month raised the groundwater by over 2m to level off about 5m below the land surface. The latter half of January was relatively (ha!) dry with less than 15 mm rain per 5 days and the groundwater levels ceased to rise significantly. Then we have Ciara and Dennis.
These events caused another sharp rise, and it might have been predicted that if rainfall levels remained less than 15 mm per 5 days then the water table would have settled at about 1.7m below the surface (blues dashed line in the figure).
Sadly it has been persistently wet ever since and the 5 day rainfall amounts have exceeded the 15mm threshold by some margin.
If this rainfall pattern persists then the groundwater will reach surface levels by early April, and every mm of rain we get from now on is most unwelcome.
To stabilise the situationwe need very much less than 15 mm rain per 5 days for the next few weeks. These observations are tentatively based on a set of data that is far too short to be reliable, but they do portray a situation that is still very much in the balance.

Dave Mattey
March 10th